Models
Metronamica incorporates several simulation models that are coupled using the Geonamica software environment. These models start at a certain year in the past for which the required input data is available. Then the models take annual steps to calculate future states up to a certain end time — this can be up to 50 years in the future. The incorporated models work on different geographical scales to represent the different processes taking place in the real world.
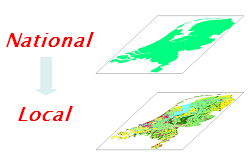
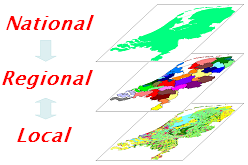
Metronamica can work in one of two configurations as depicted below. The left image shows the geographical scales in the single layer (SL) configuration. This is best suited for cities and small regions. The right image shows the geographical scales in the multi layer (ML) configuration. This is better suited for larger regions and countries, where multiple agglomerations are present. When you set up an application for your own region, you can choose whether you want an SL or ML configuration.
SL configuration 
ML configuration 
Models at each geographical scale
At the highest geographical scale, trends of future employment, population or surface areas can be entered. For SL applications, these trends are directly fed to the local model. For ML applications, the change in employment or population is fed to the regional model. This distributes those changes over the different regions and also models inter-regional migration of jobs and people. The regional model then translates these figures into surface areas for the different land uses that are fed to the local model.
The local model takes care of the spatial allocation of the surface area demands for the different land uses that it receives from either the highest level (for SL applications) or the regional level (for ML applications). This model represents space on a regular grid of cells. Each cell depicts the dominant land use in that area. This land use map is used to calculate a range of spatial indicators that each portray a different aspect of the landscape.

